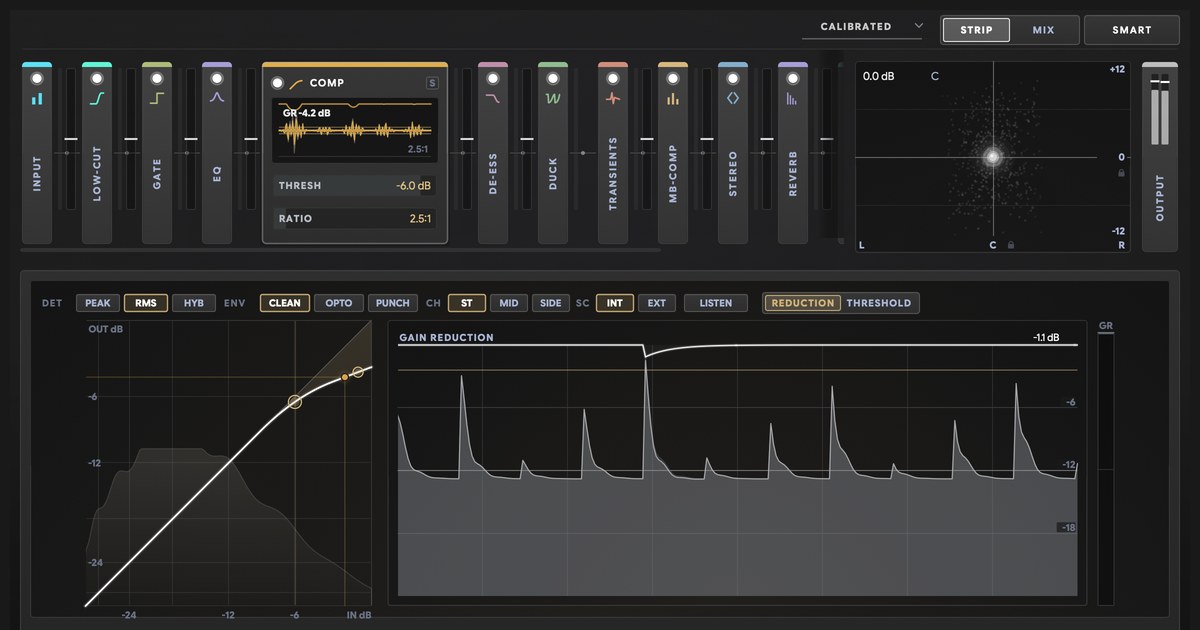
Channel Strips Are A Compromise. THE_STRIP 3's 15 Modules Are As Pristine As It Gets — Measured.
Most channel strips are a compromise. THE_STRIP 3 isn't, and 'pristine' is a number I can show you: flat to -0.0016 dB when it's off, saturation artefacts 142 dB under the signal, 3.42% of one core with all fifteen modules running. Every figure measured on the shipping engine — and when I measured past my own test suite, two of the three findings I'd published turned out to be faults in the tests, not the plugin.
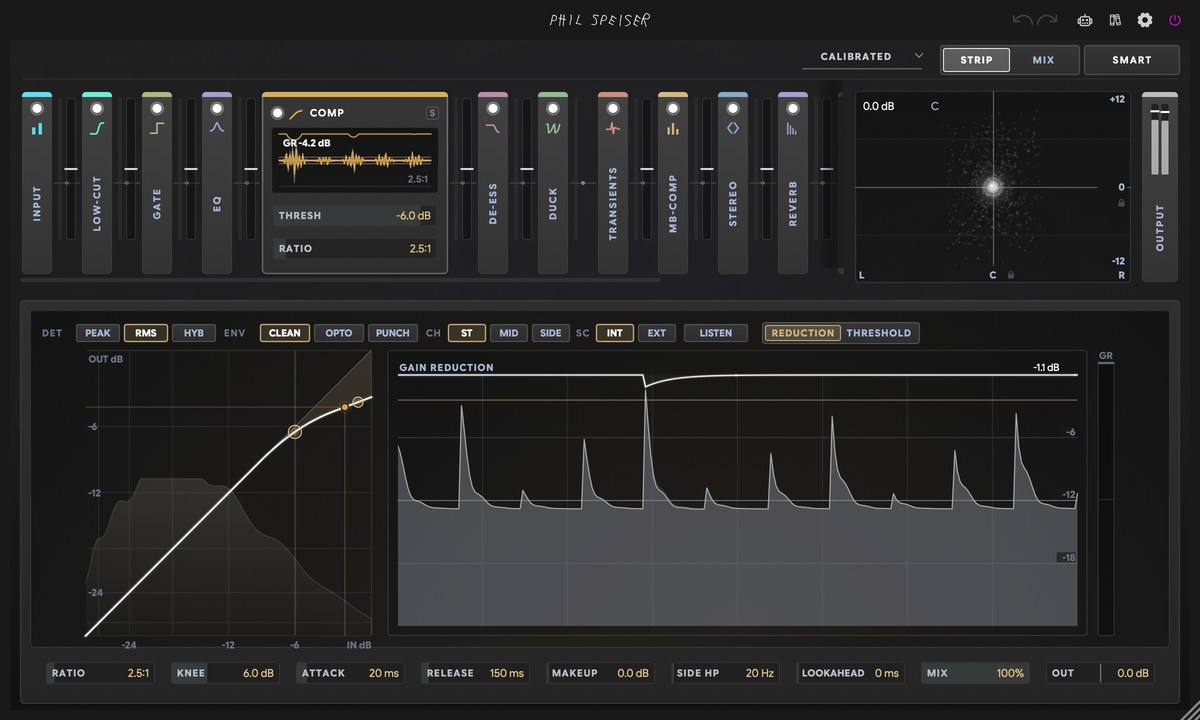
Eight plugin windows open on one vocal bus. A high-pass you trust, a boutique EQ, the compressor everyone swears by, a de-esser, a saturator, a limiter. It sounds good. It also took forty minutes, and you have thirty more tracks.
So you reach for a channel strip, and the old thought shows up:
"There's no way fifteen modules in one plugin are as good as fifteen real plugins."
That thought is usually right, and I want to say so before I say anything else. Most channel strips are a compromise. Fifteen modules in one window normally means one budget — CPU, screen space, development months — split fifteen ways. So the filter is "close enough." The saturation is a curve somebody drew once. The attack knob is a suggestion rather than a specification. Stock DAW strips genuinely were afterthoughts, and you learned to distrust them for good reasons.
You're not being cynical. You're being experienced.
So I built THE_STRIP 3 to be the exception. Its fifteen modules are as pristine as digital audio gets.
That is an enormous thing to claim, and a claim that size is worth nothing without numbers bolted to it. Fortunately, "pristine" is a number. Here are three of them before anything else, all from the exact engine that compiles into the installer:
- −0.0016 dB. How far from flat the whole strip is when every module is off.
- −142.0 dB. The worst saturation artefact at 8x CLEAN — a wider gap between signal and garbage than human hearing spans end to end.
- 3.42 % of one core, with all fifteen modules running at once.
THE_STRIP 3 measured DSP performance — the short version
| Measurement | THE_STRIP 3 result |
|---|---|
| Magnitude flatness, all modules off | −0.0016 dB across 20 Hz – 20 kHz |
| THD+N at 1 kHz, all modules off | −153.02 dB |
| Self-noise on digital silence | −240.00 dBFS |
| A module set to zero mix vs disabled | bit-identical, 0.000000000000 delta |
| Butterworth low-cut corner accuracy | −3.010 dB vs −3.010 dB ideal, every slope |
| EQ gain accuracy | +6.00 dB measured for a +6.00 dB target |
| Compressor ratio accuracy | 4.00:1 measured for a set 4:1 |
| Best saturation alias rejection | −142.0 dB (Console, 8x CLEAN) |
| Alias floor vs input level | held near −171 dB across 47 dB |
| Worst latency reporting error | 0.84 samples (17.5 µs at 48 kHz) |
| CPU, all 15 modules enabled | 3.42 % of one core |
| Automated checks | 666 passed, 0 failed, 4 sample rates |
Two things I want to get out of the way first
Before the receipts, the two questions a sceptical reader should be asking. You deserve them at the top, not buried at the bottom.
I did not measure anybody else's plugins. No rival numbers, no anonymised competitors, no ranking. That's deliberate, and it isn't modesty — it's that a competitor's performance is a moving target and their marketing is a moving target, while the theoretical ideal doesn't move at all. A 24 dB/oct Butterworth high-pass has exactly one right answer. A +6 dB bell has exactly one right answer. Measuring against the target is a harder test than measuring against a rival, because nothing can beat +6.00 dB for a +6 dB request — it can only match it or miss.
And that last row of the table — 666 checks, zero failures — is the number I trust least. I wrote those checks. I also wrote the thresholds they assert against. A pass count only proves the engine clears a bar I set myself, and any developer can raise their pass count by writing more forgiving tests. So treat it as a regression net, not as proof of quality. The numbers worth arguing with are the absolute ones — the −0.0016 dB, the −142.0 dB, the 0.84 samples — because those are values you can go and check against physics rather than against my opinion.
That's also why this article ends on the four measurements that don't flatter me — and why the full measurement report is published here, every section, in the order the suite ran them. If you'd rather check my numbers than read my prose, start there and come back.
Why I measured any of this
When I started work on THE_STRIP 3, one thought wouldn't leave me alone:
What if every single module in the strip could match — or even outperform — the most expensive, most acclaimed plugins in the world?
The compressor. The dynamic EQ. The limiter, the filters, the warmth — all on that level. THE_STRIP 2 was already strong, but "strong" is something you say. I wanted to promise you, as a fact, that the processing in here stands with the very best tools available anywhere.
Ears are king in audio — they always will be. But processing quality isn't only taste. You can put a number on it. So I started measuring, benchmarking, and coding — and I hated myself more than once, because all of it had to fit inside one streamlined plugin that sets itself up.
But now I can finally say it: I did it. 🍾
What "pristine" actually means
When someone says a strip can't be as clean as a chain, they mean four testable things:
- The strip taxes you even when you're not using it. Fifteen modules colouring your track before you turn a single knob.
- The modules are approximations. A "24 dB/oct filter" that isn't really 24 dB/oct. A "+6 dB bell" that gives you +5.4 and a tilt you didn't ask for.
- The saturation is cheap. Whatever anti-aliasing a dedicated distortion plugin does, a strip surely does less.
- It hides its costs. Latency it reports wrong, CPU that balloons, behaviour that changes at 96 kHz.
Everything below was measured in THE_LAB, my plugin measurement tool, hosting the exact engine that compiles into the VST3, AU and AAX you install — not a simulation, the shipping code. Apple silicon, Release build, 48 kHz unless noted; aliasing tests at 44.1 kHz, because fold-back is worst there.
1. Off is off
With every module disabled, THE_STRIP 3 is a wire: −0.0016 dB flat from 20 Hz to 20 kHz across 1998 measured points, −153.02 dB THD+N, −240 dBFS self-noise on digital silence, 0 samples of latency, normal polarity.
All fifteen modules off. The shaded band is the ±0.10 dB acceptance threshold; the gold line is the measured envelope.
| Measurement | Result | Acceptance threshold |
|---|---|---|
| THE_STRIP 3 magnitude flatness, 20 Hz – 20 kHz | −0.0016 to −0.0000 dB | ≤ 0.10 dB |
| Gain at 1 kHz | −0.00 dB | 0.00 ±0.05 dB |
| THD+N at 1 kHz | −153.02 dB | ≤ −110 dB |
| Self-noise on digital silence | −240.00 dBFS | ≤ −140 dBFS |
| Reported latency, all modules off | 0 samples | — |
| Measured points in band | 1998 | — |
Envelope, not a swept curve — the report publishes the bounds (−0.0016 dB to −0.0000 dB) rather than per-point data, so both bounds are drawn. At this scale they are one line.
And a module at zero isn't a module. I set the MOD stage to mix 0 and compared it sample-by-sample against the stage being fully disabled: bit-identical, a delta of 0.000000000000, in all four modes.
That difference has a practical edge. In a chain, every plugin you left inserted "just in case" is still running, still resampling, still reporting latency — which is why a session can drift without you touching anything. Here, a module you're not using is arithmetically absent. You can leave the whole rack loaded on a track and audition your way into a sound, and the parts you haven't reached yet cost you nothing.
Stability is the same story. All 321 parameters swept to both extremes stay finite and bounded. The delay at 0.95 feedback peaks at −1.41 dBFS and decays to −64.51 dBFS within thirty seconds. The reverb tail falls monotonically to −100 dBFS. Nothing explodes, nothing rings up, nothing pushes past the limiter's ceiling.
That's the floor — it isn't an achievement, it's just the part the objection gets wrong first. Now the parts that took the actual work.
2. Is a module in a strip a real module?
For the linear parts of a mixing chain, there is no "better." There's correct. A 24 dB/oct Butterworth high-pass has exactly one right answer — the maths was settled in 1930: −3.01 dB at the corner, maximally flat below it. A plugin can miss that number. It cannot beat it.
So the only question that matters: does the strip hit the number?
Corner at 200 Hz, resonance 0. Dashed grey traces are the Butterworth magnitude response, computed. Gold marks the measured corner. Hover for figures.
| Slope | Corner measured | Textbook ideal | Error |
|---|---|---|---|
| 6 dB/oct | -3.01 dB | -3.01 dB | 0.00 dB |
| 12 dB/oct | -3.01 dB | -3.01 dB | 0.00 dB |
| 24 dB/oct | -3.01 dB | -3.01 dB | 0.00 dB |
| 48 dB/oct | -3.01 dB | -3.01 dB | 0.00 dB |
The dashed curves are computed; the gold point is the measurement. The corner lands on the textbook value at all four slopes, so the four measured points sit exactly on top of one another.
Corner error across 6, 12, 24 and 48 dB/oct: 0.000 dB — the corner lands at −3.010 dB against a −3.010 dB textbook ideal at every slope, and the steepest skirt measures 48.166 dB/oct against an ideal of 48.166. Passband maximum: −0.000 dB at every slope. No ripple, no lift, no "character" smuggled in below the corner.
There is a story attached to that table, and it is not the one I published first. The original report had the steepest slope overshooting its label at 51.4 dB/oct, carried as an open finding against my own product. It turned out my analyser was reading the wrong frequency window. The filter was always exact; the measurement wasn't. That is the first of three things I got wrong or found by looking past my own tests, and all three are waiting at the end of this article.
The EQ and the dynamics hit their numbers the same way:
| Test | Target | Measured |
|---|---|---|
| EQ bell at 1 kHz | +6.00 dB | +6.00 dB |
| EQ shelves, low and high | +6.00 dB | +6.00 dB |
| EQ phase / added latency | — | minimum phase, 0 samples |
| Editor curve vs rendered audio | — | agrees within 0.09 dB |
| Compressor ratio at a set 4:1 | 4.00:1 | 4.00:1 |
| Ducker depth at a set 12 dB | 12.00 dB | 12.06 dB |
| Gate attenuation below threshold | ≥ 30 dB | 75.76 dB |
| Multiband crossover reconstruction | 0.00 dB | 0.00 dB |
The row nobody thinks to test is editor curve vs rendered audio: I compared the curve drawn on screen against the audio that actually came out. Worst disagreement across the whole band, 0.09 dB. The picture isn't a decoration. It's a promise the audio keeps — which means you can dial a cut by eye, at 2 a.m., on headphones you don't fully trust, and the render will do what the screen said.
Same with the ducker: it ducks the same 12 dB whether the trigger hits at −3 dBFS or −20 dBFS. That's the difference between a control you set once and a control you re-learn every session.
These aren't approximations of a real EQ and a real compressor. They're the numbers real EQs and compressors are aiming at.
3. How clean is the saturation?
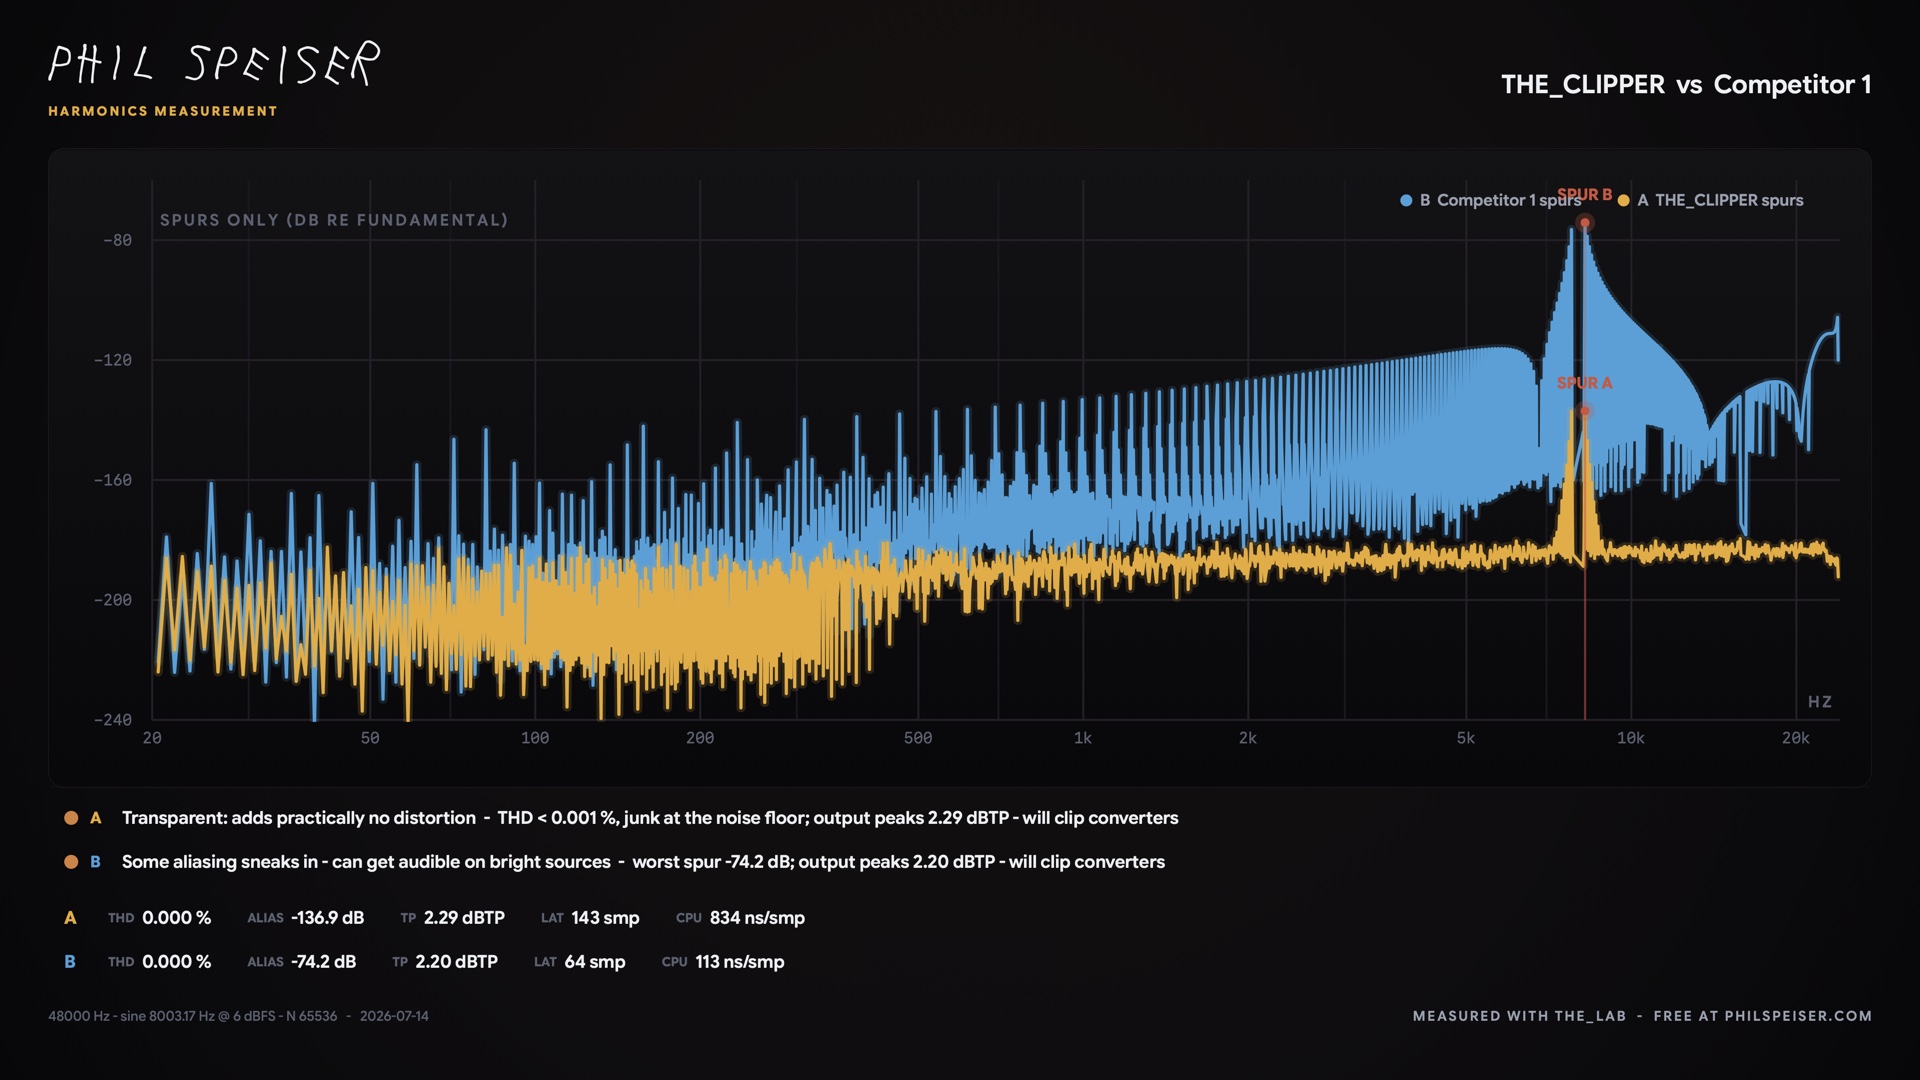
Fair suspicion, because saturation is the one place a strip could genuinely be worse. A nonlinearity manufactures harmonics above Nyquist that fold back into the audible band as aliasing — inharmonic junk that makes distortion sound digital. It's the same failure I went after in THE_CLIPPER, and the same measurement exposes it here.
An 8003 Hz tone at −1 dBFS, drive at 0.7, 44.1 kHz, limiter disabled. Decibels below the fundamental — more negative is cleaner:
| Model | 1x | 4x Fast | 4x CLEAN | 8x Fast | 8x CLEAN |
|---|---|---|---|---|---|
| Tube | −16.5 | −55.6 | −57.1 | −55.6 | −76.1 |
| Transformer | −11.3 | −49.1 | −72.2 | −49.1 | −129.0 |
| FET | −7.7 | −32.5 | −32.5 | −44.5 | −44.5 |
| Tape | −12.3 | −50.3 | −61.2 | −49.9 | −111.8 |
| Diode | −12.8 | −50.6 | −54.8 | −50.6 | −73.3 |
| Console | −12.9 | −50.8 | −97.0 | −50.8 | −142.0 |
8003 Hz at −1 dBFS, drive 0.7, 44.1 kHz, limiter disabled. Console on Fast filters against Console on CLEAN, with FET for contrast. Every point measured. Lower is cleaner.
| Saturation model | 1x | 4x Fast | 4x CLEAN | 8x Fast | 8x CLEAN |
|---|---|---|---|---|---|
| Console | −12.9 dB | −50.8 dB | −97.0 dB | −50.8 dB | −142.0 dB |
| Transformer | −11.3 dB | −49.1 dB | −72.2 dB | −49.1 dB | −129.0 dB |
| Tape | −12.3 dB | −50.3 dB | −61.2 dB | −49.9 dB | −111.8 dB |
| Tube | −16.5 dB | −55.6 dB | −57.1 dB | −55.6 dB | −76.1 dB |
| Diode | −12.8 dB | −50.6 dB | −54.8 dB | −50.6 dB | −73.3 dB |
| FET (hard clipper) | −7.7 dB | −32.5 dB | −32.5 dB | −44.5 dB | −44.5 dB |
The two Console traces are the same model at the same oversampling factor — only the decimation filter differs. Fast stops improving after 4x; CLEAN keeps going. The full six-model matrix is in the table below the chart.
Put those two in absolute terms, because that's where they stop sounding like specifications. The fundamental sits at −1 dBFS, so Console's worst artefact lands at −143 dBFS and Transformer's at −130 dBFS. Console is one decibel above the theoretical noise floor of a 24-bit file, and both are below the noise floor of any converter you can buy — there is no recording chain that could carry them to you even if you wanted them.
The ratio is the part worth sitting with. 142 dB between the signal and the junk it manufactures. Human hearing spans about 120 dB, from the quietest sound you can detect to the point where it hurts. You could amplify that artefact by 100 dB and still not find it.
There's a setting lesson sitting in that table, and it's worth more to you than the headline figure. Look down the two Fast columns: on five of the six models they're the same number. −50.8 and −50.8 on Console. −55.6 and −55.6 on Tube. −50.6 and −50.6 on Diode. With Fast filters, the improvement stops at 4x — going to 8x costs you the CPU and returns nothing. (FET is the exception, −32.5 to −44.5, and only because it starts from so much further back.)
The improvement you're actually paying for lives in CLEAN mode, not in the oversampling number. On Console that's the difference between −50.8 dB and −142.0 dB at the same 8x. So: Fast at 4x when a saturator is doing subtle glue, CLEAN at 8x when it's doing something you can hear on a lead. Anything else is spending cycles in the wrong place.
Then the test that separates good anti-aliasing from great: hold the drive, sweep the input level over 60 dB.
Drive held at 0.7 while the input is swept 60 dB. All ten points measured. Hover to compare the two settings at any level.
| Input level | 2x Fast | 8x CLEAN | Difference |
|---|---|---|---|
| -60.0 dBFS | -153.27 dB | -171.97 dB | +18.70 dB |
| -53.3 dBFS | -139.85 dB | -171.03 dB | +31.18 dB |
| -46.7 dBFS | -126.55 dB | -170.80 dB | +44.25 dB |
| -40.0 dBFS | -113.20 dB | -171.05 dB | +57.85 dB |
| -33.3 dBFS | -99.88 dB | -170.71 dB | +70.83 dB |
| -26.7 dBFS | -86.62 dB | -171.52 dB | +84.90 dB |
| -20.0 dBFS | -73.62 dB | -171.90 dB | +98.28 dB |
| -13.3 dBFS | -61.67 dB | -172.44 dB | +110.77 dB |
| -6.7 dBFS | -51.68 dB | -148.82 dB | +97.14 dB |
| 0.0 dBFS | -30.16 dB | -125.71 dB | +95.55 dB |
At the fast setting, the alias floor climbs right along with your signal. At 8x CLEAN it doesn't move: pinned near −171 dB across a 47 dB range of input level. In practice that means the saturator sounds the same on a quiet verse and a loud chorus — you can automate the fader into the stage without the distortion character changing underneath you, which is exactly the thing that makes cheap saturation unusable on a dynamic vocal.
Notice I didn't hide FET. It's a hard clipper, and a discontinuous derivative produces a harmonic series no finite oversampling fully resolves — that's inherent to the shape, not a defect in the filtering. If I only showed you the good columns, you'd have no reason to believe the good columns.
4. What does it cost you?
Latency first, because this is the one that quietly ruins mixes. I measured the actual delay through the plugin by correlation and compared it against the number the plugin hands your DAW:
| Configuration | Reported | Measured |
|---|---|---|
| All modules off | 0 smp | 0 smp |
| 1x oversampling | 72 smp | 72.00 smp |
| 4x oversampling | 132 smp | 131.16 smp |
| 8x oversampling | 136 smp | 136.02 smp |
| CLEAN filter mode | 213 smp | 213.53 smp |
| Gate, 20 ms lookahead | 882 smp | declared up front |
| MINI — every lookahead + 8x requested | 0 smp | 0 smp |
Delay through the plugin measured by correlation, against the figure handed to the host. Plotted as absolute disagreement in samples.
| Configuration | Reported | Measured | Error |
|---|---|---|---|
| 1x | 72 smp | 72.00 smp | 0.00 smp |
| 2x | 121 smp | 121.00 smp | 0.00 smp |
| 4x | 132 smp | 131.16 smp | 0.84 smp |
| 8x | 136 smp | 136.02 smp | 0.02 smp |
| Fast | 126 smp | 126.08 smp | 0.08 smp |
| CLEAN | 213 smp | 213.53 smp | 0.53 smp |
Worst disagreement anywhere in the engine: 0.84 samples. 17.5 microseconds. And the reported figure never changes after audio starts — which matters more than the accuracy, because a plugin that revises its latency mid-session is how phase relationships silently rot between one playback and the next. Your drum bus still lines up with your room mics on the third render.
That last table row is a design decision worth naming: THE_STRIP 3 MINI, the companion you put on every track, refuses settings that would incur latency rather than quietly introducing delay. Ask it for every lookahead and 8x oversampling — it reports zero samples because it delivers zero samples.
Now CPU, with every one of the fifteen modules at full depth:
| Configuration | % of one core at realtime |
|---|---|
| All modules off | 0.16 % |
| MINI set — input, low cut, EQ, comp, duck | 0.26 % |
| Typical mix chain | 2.39 % |
| Every single module enabled | 3.42 % |
The whole rack, running at once, is 3.42 % of one core. The MINI set is a quarter of one percent — the number that lets you put it on forty tracks and never think about it again.
And none of it drifts with sample rate:
| Sample rate | Neutral flatness | Low cut −3 dB at 100 Hz | Bell +6 dB at 1 kHz |
|---|---|---|---|
| 44 100 Hz | 0.00 dB | −3.00 dB | +6.00 dB |
| 48 000 Hz | 0.00 dB | −3.01 dB | +6.00 dB |
| 96 000 Hz | 0.00 dB | −3.04 dB | +6.00 dB |
| 192 000 Hz | 0.00 dB | −3.04 dB | +6.00 dB |
The suite runs 666 checks at 44.1 and 48 kHz and 664 at 96 and 192 kHz. That gap isn't two failures — two of the checks are sample-rate-specific and simply don't apply above 48 kHz. Track at whatever rate you like; the strip doesn't have a favourite.
One more, because nobody tests it: stereo
Width is easy to fake and expensive to do without wrecking the mono sum — which is exactly why it's worth measuring.
| Test | Target | Measured |
|---|---|---|
| Width 0.0 — side collapse | −40 dB or lower | −180.00 dB |
| Width 0.0 — mid untouched | 0.00 dB | −0.00 dB |
| Width 2.0 — side gain | +6.00 dB | +6.02 dB |
| Width 2.0 — mid untouched | 0.00 dB | −0.00 dB |
| Bass mono at 200 Hz — side at 60 Hz | −12 dB or lower | −41.87 dB |
| Bass mono at 200 Hz — side at 4 kHz | 0.00 dB | −0.00 dB |
Width at 0.0 doesn't reduce the side signal, it removes it. Width at 2.0 widens around a mid that doesn't move — your lead vocal stays exactly where you put it while the synths open up around it. And bass-mono collapses the bottom without narrowing the top, so the kick and bass survive a club system summing to mono while the air on top stays wide.
So where does the chain actually lose?
Here's the one part of this article that is arithmetic, not a measurement — and I'd rather label it than let it pass as a result.
A chain's errors add up. Ten plugins each within a very respectable 0.05 dB of unity can hand you half a decibel of drift you never dialled in. Ten latency reports each off by a couple of samples add up to a phase relationship that's quietly wrong. That's just how tolerances stack, and it's true of any serial chain of anything.
What makes it hard to argue about is that you can't check it. The number you'd need is the number for the assembled chain — every plugin in place, in order, at your settings — and nobody publishes that, including for chains built entirely from great plugins.
The strip is one measured path. Those 666 checks don't run on fifteen modules in isolation — they run on the engine you actually insert, stages talking to each other, gain-staged to a single −12 dB reference so every threshold in the rack reads in real dB. A chain of great plugins is a sum of parts that were each measured alone. A strip can be measured whole.
I'm not going to dress that up as a proof I haven't run. It's a structural argument, and it's the reason I built the strip the way I did.
What happened when I went looking past my own tests
I said at the top that the 666 is the number I trust least, because I wrote the checks and I wrote the thresholds they asserted against. So I measured past them, and published what came back.
The first version of this article listed three findings against my own product. Then I took every one of them back to the source code. Two of the three were not findings in the plugin at all. They were faults in the way I was measuring it. That is not a comfortable thing to print under my own name, and it is exactly what the exercise was for.
1. The steepest low cut was never steeper than its label. I published 51.4 dB/oct against a 48 dB/oct nominal. Measured directly on the shipping code with a coherent single tone, the filter is an exact 8th-order Butterworth: the corner lands at −3.010 dB against a −3.010 dB ideal at every slope, and the steepest skirt measures 48.166 dB/oct against an ideal of 48.166. The 51.4 came from my analyser reading the wrong frequency window — fc/4 to fc/2, not the fc/8 to fc/4 the report described — off a smoothed multisine at −96 dB. The same analyser, on the same unchanged filter, returns 48.5, 48.4, 48.2 and 44.9 dB/oct at 44.1, 48, 96 and 192 kHz. The number moved. The filter never did. Retracted, and the metric is fixed.
2. The compressor's attack and release aren't off either. I published that a set 10 ms measures 23 ms and a set 100 ms measures 26 ms — the second figure implying a control that barely does anything. It does not reproduce. Attack runs 5 to 335 ms across its range and release 22 to 786 ms, both monotonic, with no flat region anywhere; at a set 100 ms, attack reads 171 ms. The time constant is exactly the value on the knob. The consistent offset in my original figures was the 63 %-of-gain-reduction convention measured with a burst that started below threshold — a property of my test, not of the compressor.
3. The EQ's bells narrow near the top of the spectrum. That one is real, and it's a choice. A bell centred at 16 kHz keeps 71.8 % of its 1 kHz shape at 44.1 kHz. It matches the textbook bilinear maths to 0.01 dB — it is doing exactly what a correct bilinear IIR does, which is also what most of the IIR EQs already in your session do, whether or not they publish the number.
It could be changed. A Nyquist-matched coefficient set would do it for about 0.001 % of one core, so this isn't a CPU question. The reason it stands is simpler: changing the transform would alter the shape of every high-frequency EQ setting you have already saved. I'm not willing to improve a curve by reaching into work you've finished. It goes in behind a state version that leaves your sessions exactly as you left them. In the meantime it's confined to the top octave, it disappears entirely at 96 kHz, and on a real-material render it had no measurable effect at all.
Update, October 2026: it went in. Version 1.2 (September 11) moved every bell to a Nyquist-matched design. The worst deviation at 44.1 kHz dropped from 1.94 dB to 0.41 dB, at no extra cost per sample, and your saved sessions load unchanged.
So: of the three things I published against my own product, two were my instruments, not the engine. The third was real, and it's fixed.
That is what a pass count is worth. 666 of 666, zero failures — and the only way to find out what it was really worth was to measure past it. The engine came back exact. My instruments didn't. I'd rather hand you that than a clean sheet.
Test the same things on your own chain
To be clear about what's mine and what's yours: the acceptance suite that produced these numbers is my internal test rig inside THE_LAB. It hosts the exact engine that ships, and it's how a regression gets caught before it ever reaches an installer. The suite itself isn't in the box.
The report it produces is, though. Every section of it is published here — all seventeen, in the order the suite runs them, with the recorded test conditions and the open findings, and it's downloadable as a plain text file if you'd rather pull it into your own notes. I've cut exactly one thing from it: the internal command lines that drive my test runner. Nothing else.
And the tests aren't magic — none of them need my tools. Here are the exact conditions I used, so you can run the equivalent on your chain with any analyser you already own.
Is your chain actually flat when it's off? Bypass or zero every module, send a 20 Hz–20 kHz sweep through, and look at the return. Mine holds inside 0.0016 dB. Anything under 0.1 dB is fine; a visible tilt means something in the chain is always on.
Is your favourite high-pass the slope printed on it? Set the corner to 200 Hz, resonance zero. Check the level at the corner — Butterworth says −3.01 dB — then measure the slope between 25 Hz and 50 Hz (fc/8 to fc/4) and compare it to the number on the knob.
How clean is your saturator? Feed it a single 8003 Hz sine at −1 dBFS at 44.1 kHz, drive around 0.7, with any limiter after it switched off. That odd frequency is deliberate — it isn't a neat divisor of the sample rate, so aliases land in obvious places instead of hiding on top of real harmonics. Then look at everything that isn't a harmonic of 8003 Hz. Then do it again 20 dB quieter and see whether the junk moved down with the signal or stayed where it was.
You may well find your chain measures beautifully. What you won't find is the thing the objection assumes: a strip that had to be watered down to fit fifteen modules in one window.
The part no measurement can reach
Everything above answers one question: whether the processing is good enough. None of it touches the reason those eight windows took forty minutes in the first place — you had to build the chain yourself.
So the strip builds it.
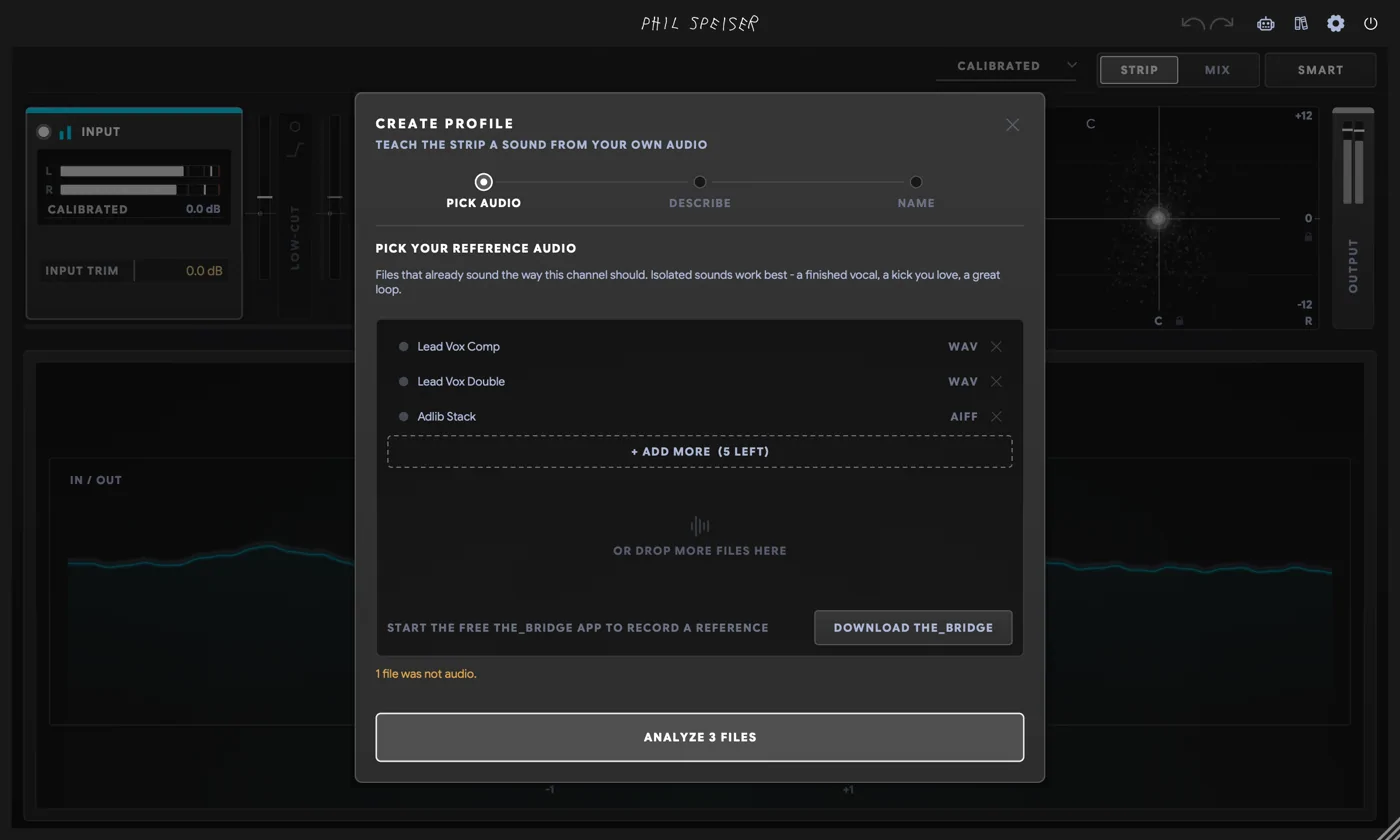
SMART SETUP listens to the actual audio on the track. Not the track name, not a preset guess: press it, play the song, and it analyses three, six or twelve seconds of real material against 81 profiles — or against profiles you build from your own reference tracks. Then it writes the chain: input trim, the three strongest tonal EQ moves plus dynamic notches on measured resonances, crest-tiered compression, de-essing from the real high-frequency envelope, transients, width, saturation. It reports what it did in plain language, and one undo takes it all back.
It also remembers what it heard for the last sixty seconds, so a listen over a quiet breakdown still sets the level the chorus needs — and it tells you when that happened. If it can't hear anything, it says so instead of inventing a setting: NO SIGNAL — PRESS PLAY. It listens. It never guesses.
Then it stops behaving like a channel strip at all. Every instance finds every other one, with zero routing. Press AUTO-MIX and the session mixes itself: it sets up the strips that need it, ranks your tracks so the losers step back only where and while the winner is actually playing, arms the kick ducks, spreads the stage, then balances tier by tier — tracks, then buses, then the master — until the sum sits on target.
Every decision comes back as a ledger, one line per track. Strips you've already hand-tuned can be locked so it keeps its hands off them. And one undo takes back the entire run, across every instance at once.
It isn't the finished record. It's the balanced starting point you'd otherwise spend a day building, delivered in the time it takes to play the song once. You take it from there — drag the pecking order, ride the faders, promote whoever should win.
And everything it does lands as ordinary settings you can read, change, or throw away. No black box, nothing locked.
Which is the whole reason the numbers above matter. A strip that mixes for you is only worth having if the processing underneath it is worth trusting — and that is what the last four thousand words were for.
So: strip or chain?
Reach for a specific plugin when you want that plugin's character — no measurement in this article argues against taste, and I'd never tell you to give it up.
But the belief that a channel strip must be sonically second-rate because it's a channel strip? That one's testable, and it doesn't survive the test. In THE_STRIP 3 the Butterworth corner lands at −3.010 dB against a −3.010 dB ideal at every slope. A +6 dB bell measures +6.00 dB. A 4:1 ratio compresses at 4.00:1. An unused module is bit-identical to no module. The saturation holds its worst artefact 142 dB under the signal, and holds it there across 47 dB of input. The whole rack costs 3.42 % of one core, and the latency figure is honest to 17.5 microseconds.
Four sample rates. 321 parameters. Every number above measured on the shipping engine — and everything I found by measuring past my own tests, published whether it flattered me or not.
Now go back to the top of this article, to that vocal bus with eight windows open on it.
The forty minutes were never the price of quality. That's the part this whole article set out to prove, and the numbers settle it. The forty minutes were the price of assembly — choosing the plugins, ordering them, gain-staging between them, reconciling their latency, and then doing all of it again on the next track, and the twenty-nine after that.
That's what you're actually buying back. One window. One measured signal path. Fifteen modules gain-staged to a single −12 dB reference before you touch a control — which is also why every threshold in the rack reads in real dB instead of in a number you have to learn. And MINI on every other track in the session for a quarter of one percent of a core.
The quality question is settled above, and the report is sitting right there if you'd rather check it than take it — including the parts I had to retract. The time question settles itself the first evening you use it.
How I measured this
- Material
- Sine sweeps, single tones (1 kHz, and 8003 Hz at -1 dBFS for aliasing), impulses, noise, DC, digital silence, and one real programme-material render
- Versions
- THE_STRIP 3 shipping engine, plus THE_STRIP 3 MINI for the latency checks
- Measured on
- 2026-08-27
- Settings
- Every linear module measured against its textbook target: Butterworth low cut at 6, 12, 24 and 48 dB/oct, +6 dB and -6 dB bells, a 4:1 ratio
- Saturation at drive 0.7 from 1x to 8x oversampling, in Fast and CLEAN filter modes
- All 321 parameters swept to both extremes
- Held constant
- Same engine build, same signals and levels at all four sample rates: 44.1, 48, 96 and 192 kHz
- Notes
- 666 automated checks in THE_LAB at 44.1 and 48 kHz, 664 at 96 and 192 kHz, zero failures. Apple silicon Release build.
FAQ
Is a channel strip as good as chaining separate premium plugins?
It can be, and THE_STRIP 3 is measured to demonstrate it. For linear processing there is a correct answer rather than a better one: a 24 dB/oct Butterworth high-pass has one textbook response, and THE_STRIP 3's low cut lands its corner at -3.010 dB against a -3.010 dB ideal at every slope, with the steepest skirt measuring 48.166 dB/oct against an ideal 48.166, and no passband ripple at any slope. A +6 dB EQ bell measures +6.00 dB. A 4:1 compressor ratio measures 4.00:1. No separate plugin can be more correct than the target value.
Do unused modules in THE_STRIP 3 colour the sound?
No. With every module disabled, THE_STRIP 3 measures -0.0016 dB of magnitude deviation across 20 Hz to 20 kHz, -153.02 dB THD+N at 1 kHz, -240 dBFS self-noise on digital silence and 0 samples of latency. A module set to zero mix is bit-identical to the module being disabled: the worst single-sample delta is 0.000000000000.
How much aliasing does THE_STRIP 3's saturation produce?
At 8x CLEAN oversampling with an 8003 Hz tone at -1 dBFS and drive at 0.7, THE_STRIP 3's Console model measures -142.0 dB and the Transformer model -129.0 dB below the fundamental. The fundamental sits at -1 dBFS, so in absolute terms the worst Console artefact lands at -143 dBFS, one decibel above the -144 dBFS theoretical noise floor of 24-bit audio, and the Transformer artefact at -130 dBFS. Both are below the noise floor of any converter on the market. The alias floor also stays near -171 dB across a 47 dB range of input level rather than rising with the signal. Note that this improvement requires CLEAN filter mode: with Fast filters, oversampling past 4x makes no measurable difference.
How much latency does THE_STRIP 3 add, and is it reported accurately?
THE_STRIP 3 reports 0 samples with all modules off, 72 samples at 1x oversampling and 213 samples in CLEAN filter mode. The largest disagreement between the reported figure and the delay measured by correlation is 0.84 samples, or 17.5 microseconds at 48 kHz, and the reported figure never changes after audio starts. THE_STRIP 3 MINI reports and delivers 0 samples even with every lookahead and 8x oversampling requested, because it refuses latency-incurring settings rather than introducing delay silently.
How much CPU does THE_STRIP 3 use?
On an Apple silicon Release build at 48 kHz, THE_STRIP 3 uses 0.16% of one core with all modules off, 2.39% for a typical mix chain and 3.42% with every one of its 15 modules enabled. THE_STRIP 3 MINI's module set costs 0.26% of one core.
What are the known measurement limitations of THE_STRIP 3?
One finding that has since been fixed, plus two earlier findings since retracted. The fixed one: THE_STRIP 3 (1.0) ran its EQ bells on the standard bilinear transform, so a bell centred at 16 kHz retained 71.8% of its 1 kHz shape at 44.1 kHz. Version 1.2 (September 2026) moved every bell to a Nyquist-matched design: the worst deviation from the analogue prototype at 44.1 kHz fell from 1.94 dB to 0.41 dB, with no added cost per sample, and saved sessions load unchanged. The two retracted: the 51.4 dB/oct low-cut slope was an analyser reading the wrong frequency window, and the filter is an exact 8th-order Butterworth with its corner at -3.010 dB at every slope; and the compressor's uncalibrated attack and release do not reproduce, with the time constant matching the knob across a 5 to 335 ms attack range and 22 to 786 ms release range.
Does THE_STRIP 3 behave the same at every sample rate?
Yes. THE_STRIP 3 passes 666 automated checks at 44.1 and 48 kHz and 664 at 96 and 192 kHz, with zero failures. The two-check difference is not a failure: two checks are sample-rate-specific and do not apply above 48 kHz. Neutral flatness measures 0.00 dB, a low cut at 100 Hz measures -3.00 to -3.04 dB and a +6 dB bell at 1 kHz measures +6.00 dB at all four rates.
Does THE_STRIP 3's stereo widening stay mono-compatible?
Yes. At width 2.0 THE_STRIP 3 adds +6.02 dB of side signal while leaving the mid channel at -0.00 dB, so the centre of the mix does not move. At width 0.0 the side signal collapses to -180 dB rather than merely being reduced, and the mid is still untouched. The bass-mono filter set to 200 Hz removes 41.87 dB from the side at 60 Hz while leaving the side at 4 kHz at -0.00 dB.
Are THE_STRIP 3's delay and reverb stable at maximum feedback?
Yes. At 0.95 feedback THE_STRIP 3's delay peaks at -1.41 dBFS and has decayed to -64.51 dBFS after 30 seconds. The reverb tail decays monotonically from -29.5 to -90.3 to -100.0 dBFS with no ring-up. All five modulation modes at full depth with 0.95 feedback produce no non-finite samples and stay between -6.03 and +0.80 dBFS.
Is THE_STRIP 3 numerically stable at extreme settings?
Yes. All 321 of THE_STRIP 3's parameters were swept to both extremes with every output verified finite and bounded, 321 of 321 passing. The full chain under loud noise, impulse, DC and digital-silence stress produced no non-finite samples, and the output stayed at -0.83 dBFS against the limiter ceiling.
Is THE_STRIP 3's EQ minimum phase, and does it add latency?
THE_STRIP 3's EQ is minimum phase and adds 0 samples of latency. Its high-pass corner measures -3.01 dB against a -3.00 dB target with a 12.03 dB/oct slope against a 12.00 dB/oct nominal, and the curve drawn in the plugin's editor agrees with the rendered audio to within 0.09 dB across the whole band.
Were competing channel strips or plugins measured for this comparison?
No. No competing product was measured, ranked or anonymised. THE_STRIP 3 is measured against the theoretical target instead — the textbook Butterworth response, the set ratio, the requested gain — because that target does not move and nothing can be more correct than it. The chain-error argument in the article is arithmetic rather than a measurement, and is labelled as such.
What is measured in THE_STRIP 3's DSP report?
The report covers 666 automated checks over 321 parameters and 15 modules at four sample rates: neutral-path flatness and noise, bypass bit-identity, Butterworth filter conformance, EQ gain and phase accuracy, dynamics transfer law, stereo width behaviour, time-domain stability, saturation alias rejection, latency reporting accuracy, numerical stability, sample-rate independence, CPU cost and a real programme-material render, plus the findings from measuring past the suite's own thresholds, including three the suite had wrongly reported against the product and which are retracted in full.